|
|
|
Genetic Algorithms are one type of learning algorithms patterened after the processes underlying evolution; shaping a population of individuals through the survival of its most fit members. They view learning as a competition among a population of evolving candidate problem solutions. A "fitness function evaluates each solution to decide whether it will contribute to the next generation of solutions. Then through operations anlogous to gene transfer in sexual reproduction, the algorithm creates a new population of candidate solutions. After evaluating each candidate, the algorithm selects a pair for recombination. Recombination uses genetic operators to produce new solutions that combine components of their parents. The two commonly known genetic operators are as follows:
The genetic algorithm continues until some termination requirement is met, such as having one or more candidate solutions whose fitness exceeds some threshold.
Return to top.
Quick Description on how to run the program
How to use the Genesis GA system:
To use the Genesis GA system, do the following. Create a directory called
genesis. Copy the contents of
~juell/cs724pub/genesis/* to your genesis directory.
Change directory to genesis. Type the command setup. For the questions
"file name" and "suffix" type f1alt (F1ALT
in lower case). For all of the other questions
enter a carriage return. The carriage return causes it to use the
specified default values. This will run the
f1alt example. There are examples 1, 2, 3, 4 and 5. It is
expected, that you will take f1alt and modify it so it solves your
problem. The file f1alt.c contains two
functions: doinit and eval. The function doinit is called once, at
the start of processing and can be used to setup variables etc. The
function eval has two parameter and returns a
double floating point value. The two parameters are
a pointer to a buffer and the length of the buffer in bytes. Each byte in
the buffer represents one bit in the
chromosome. The value returned by the function is the
goodness metric for the chromosome represented by the buffer. Genesis does
a valley decent, so the lowest possible
metric value is the best answer.After you have modified the f1alt.c, it will generate the "data " file.
How to use the visualization tool:
As Virtual Reality Modelling Language (VRML) is used for visualizing
the Genetic Algorithm program in 3D space, students need to have the Cosmo Plug-in installed
in their own mechine. If you don't have the Cosmo Plug-in installed, look at the
FAQ's page for detail
information. This tool is written in perl. So after copying the perl script version10.pl to your space you need to change the permission by giving the
"chmod 755 version10.pl" command. Instead of 755, you can also use your own choice. Then run it with
"perl version10.pl" command that will generate different vrml and html files. Now open
the ga_index.html file from the common browser (preferably netscape browser).
This is the main interface from where you can navigate different visualizations that are interconnected
with each other.
Return to top.
VRML worlds of Genetic Algorithm
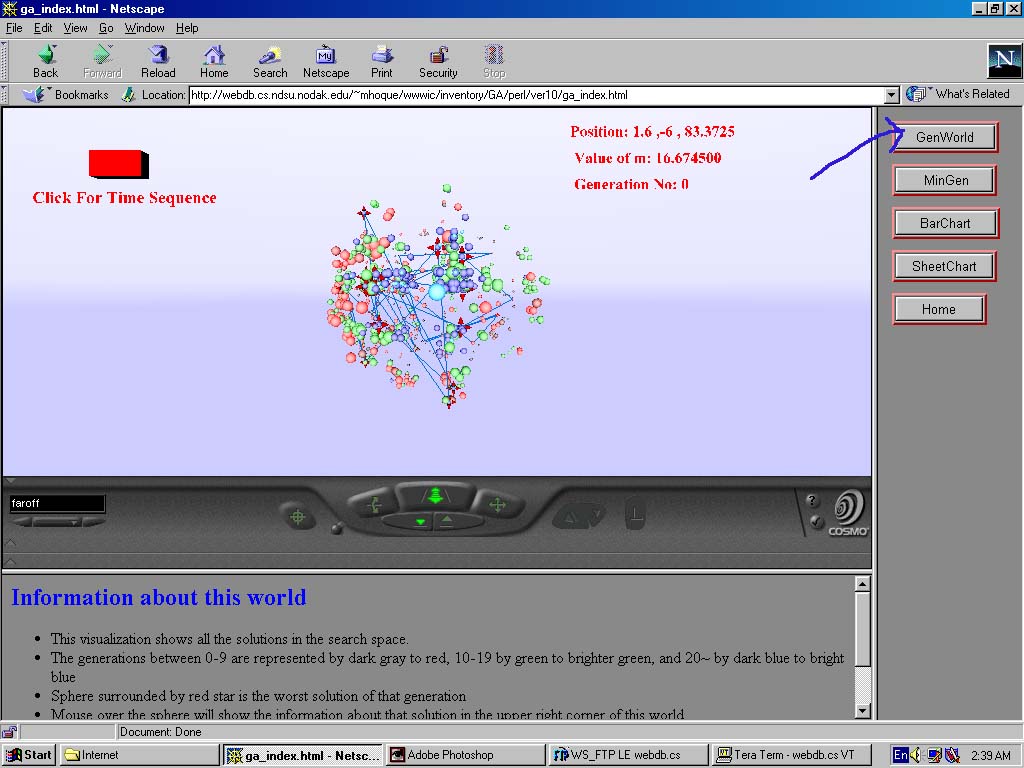
This visualization appears when you click on the GenWorld button:
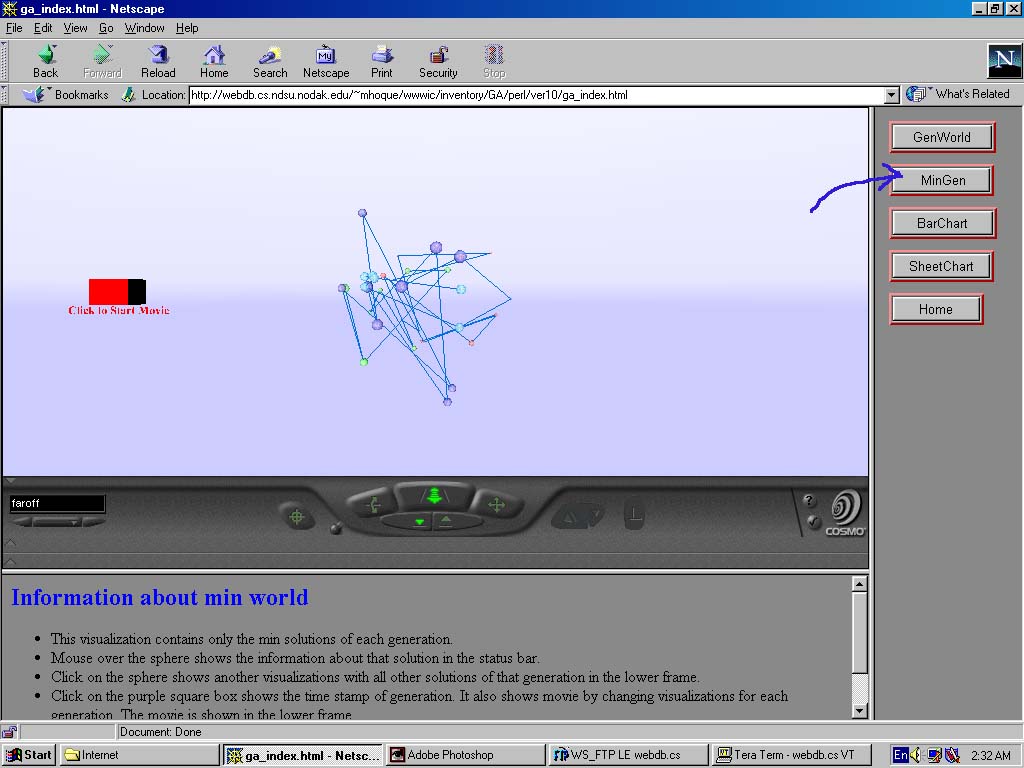
Next three snapshots are taken after clicking on the MinWorld button:
This visualization appears when you click on MinGen button.
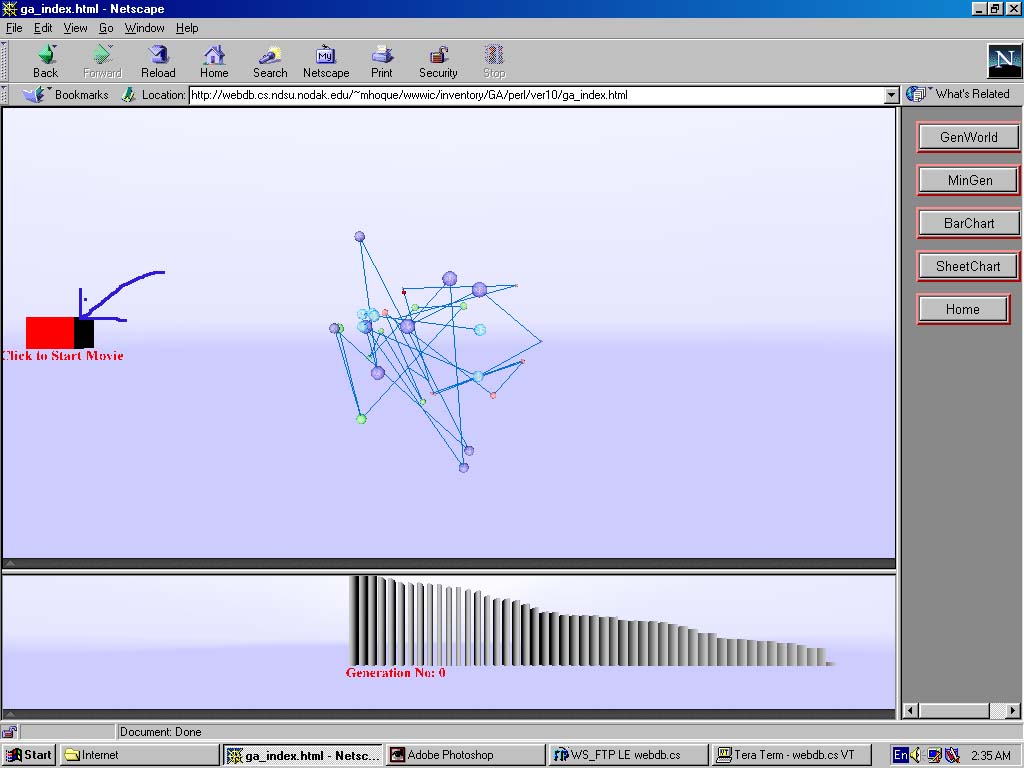
This is the screen shot after you click on the red box.
The movie is in the lower frame. It is advised to hide the control panel to see
larger view.
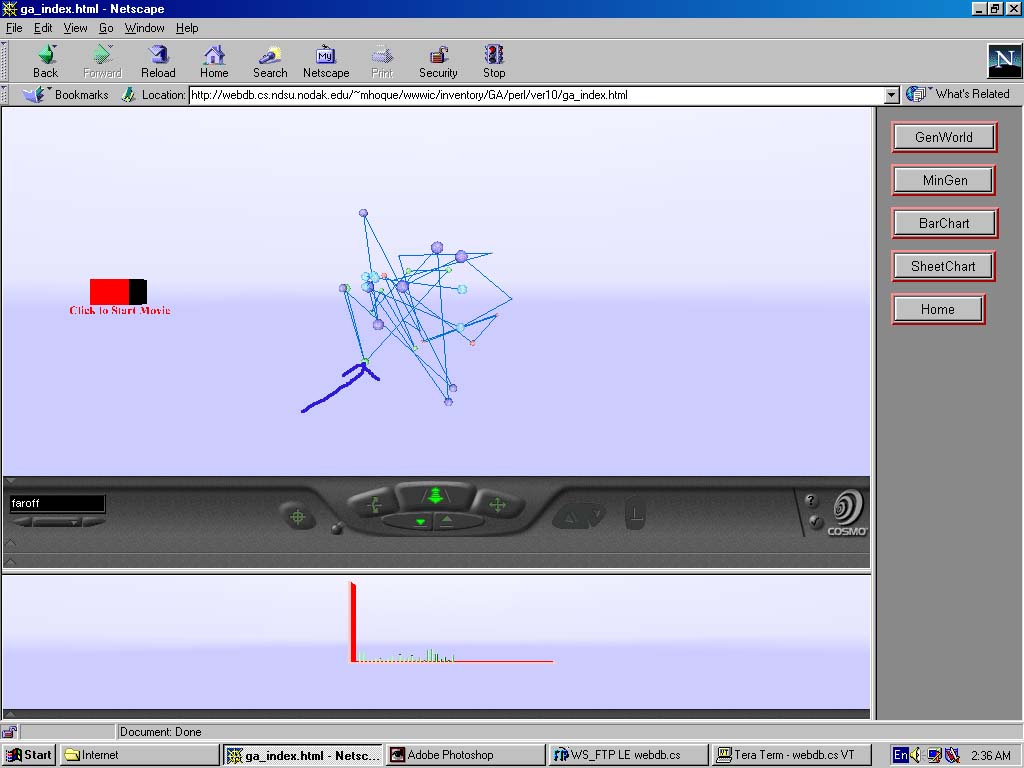
This is the screen shot after you click on a sphere.
Another visualization containing all the members of
the clicked sphere is in the lower frame.
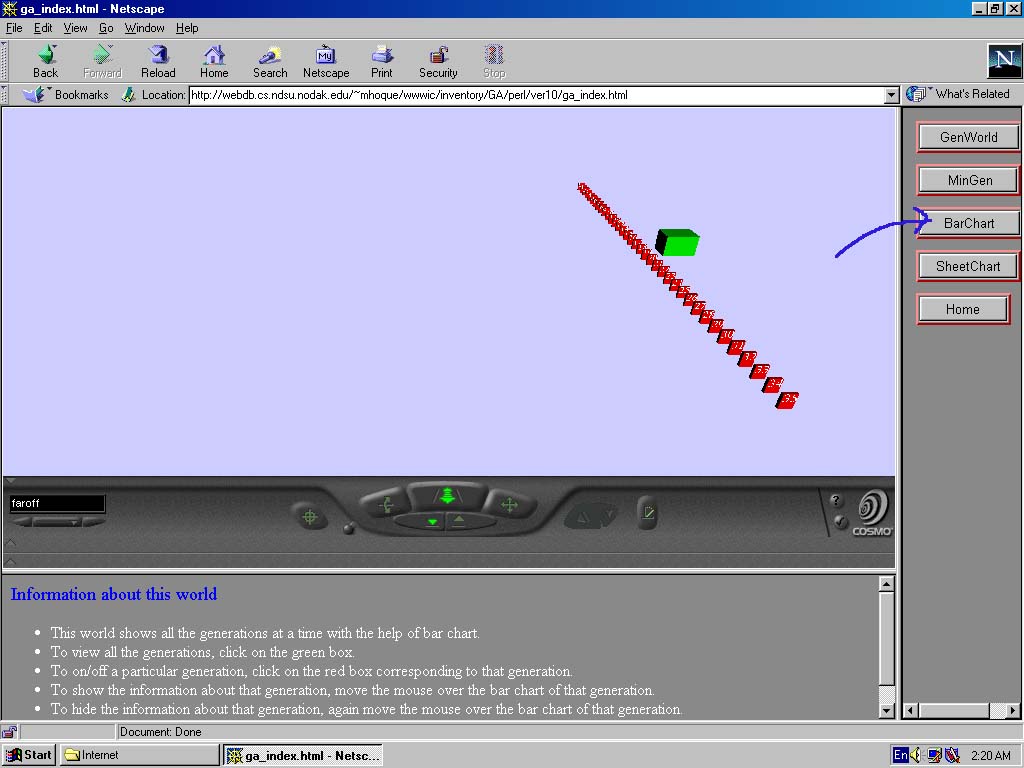
Next three snapshots are taken after clicking on the BarChart button:
This visualization appears when you click on the BarCahrt button.
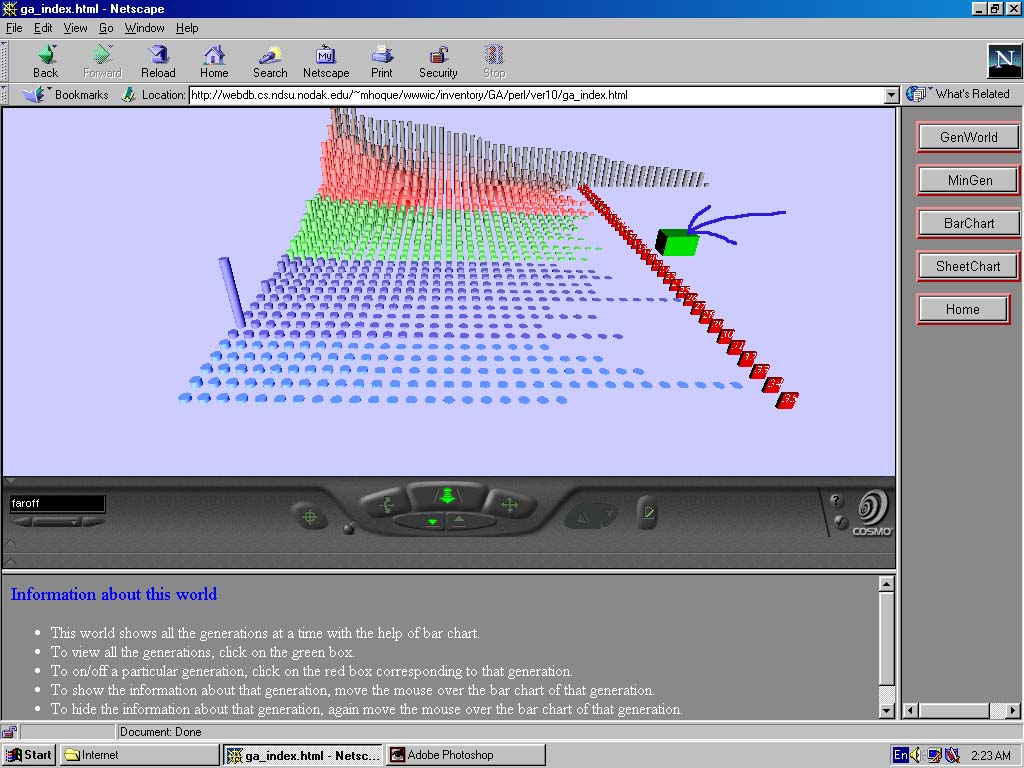
Screen shot after clicking on the green box.
Color used: dark gray to red for 0-9 generations, green to brighter
green for 10-19 generations, and dark blue to bright blue for 20+ generations.
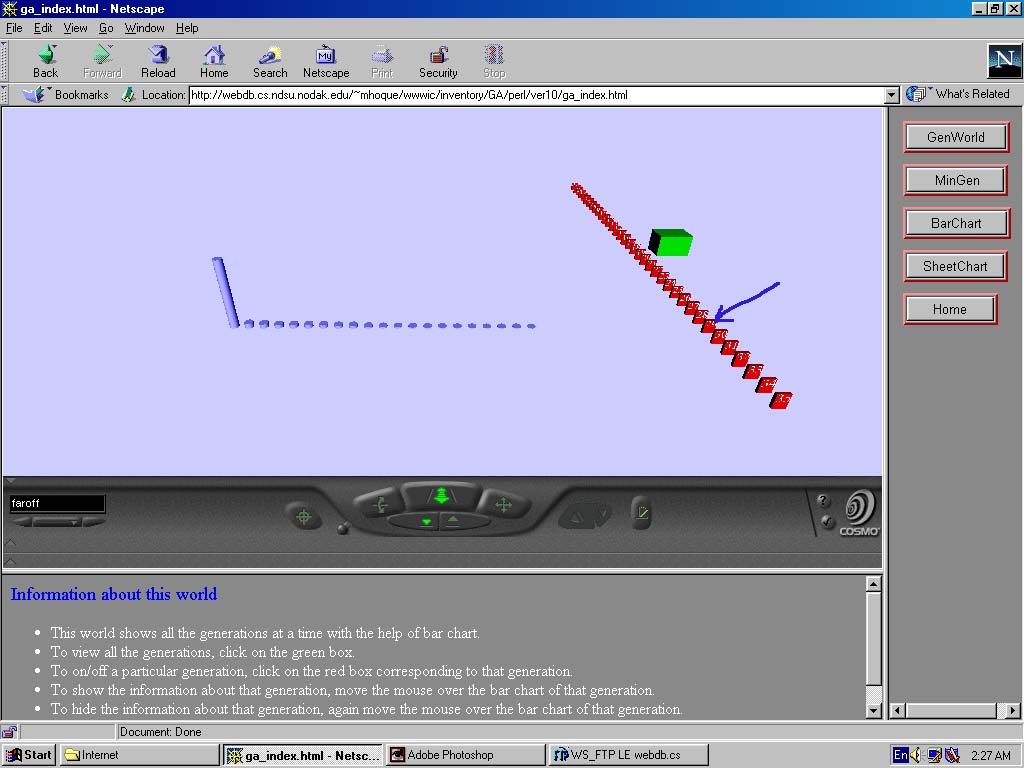
Screen shot after clicking on a red box.
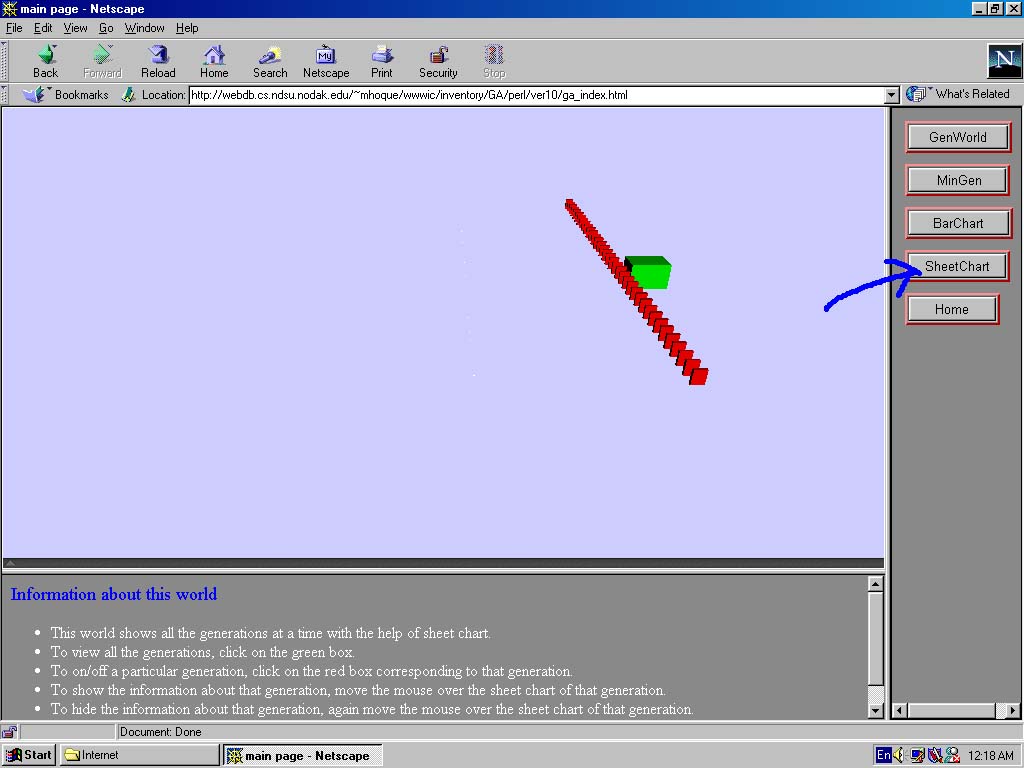
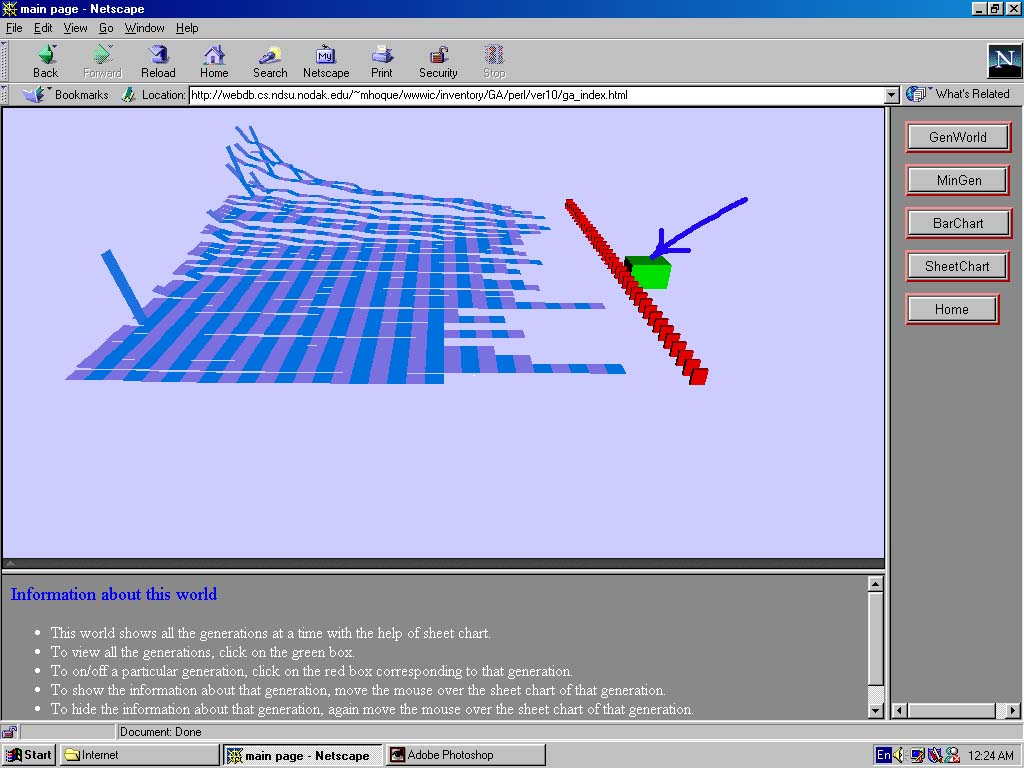
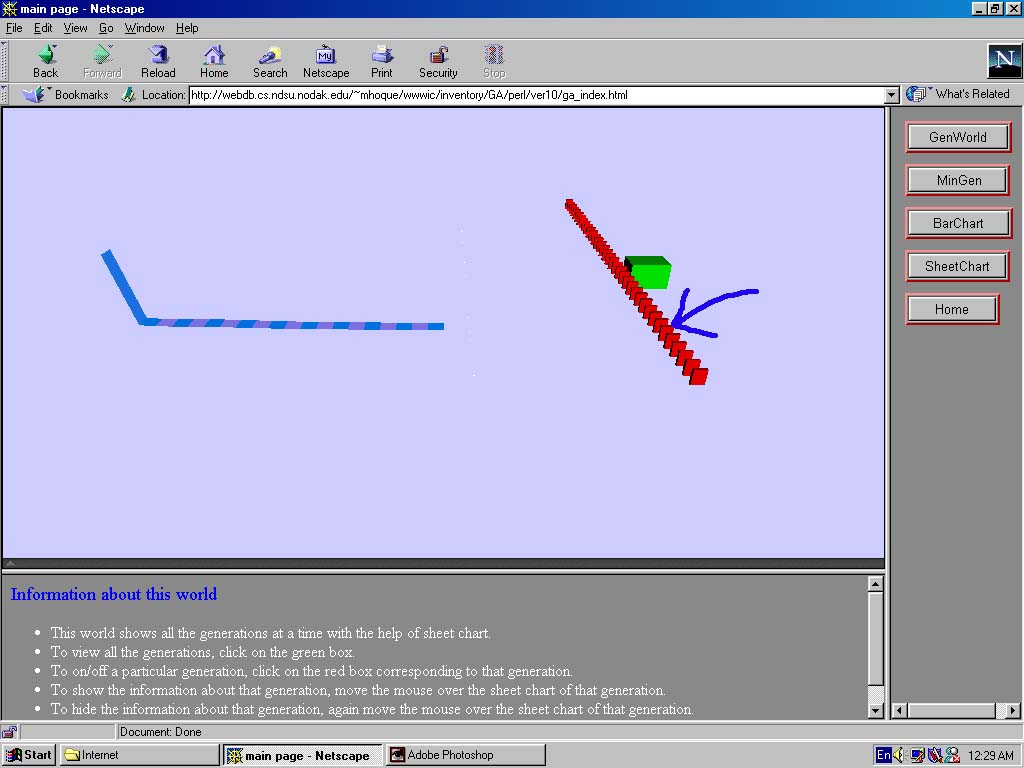
Next three snapshots are taken after clicking on the SheetChart button:
This visualization appears when you click on the SheetChart button.
Screen shot after clicking on the green box.
Screen shot after clicking on a red box.
Return to top.
Return to top.
Return to top.