Visual Program Screen Captures
Visualization of the interaction of Process and Data
Copyright © 1998. World Wide Web Instructional Committee
|
|
Visual Program Screen CapturesVisualization of the interaction of Process and Data |
|
Welcome
|
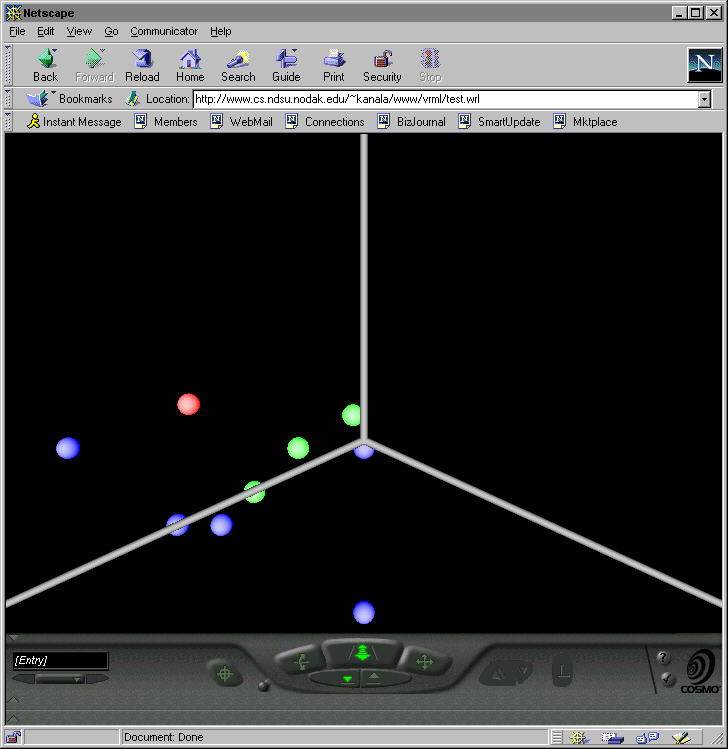
Programming techniques such as Genetic Algorithms (GA) produce
volumes of data over steps in time. One way to start understanding
what is happening is to display the data and creation times.
In this example the 3 space point is the data and the time is represented
by the color.
Copyright © 1998. World Wide Web Instructional Committee
|